
Take Control of Your Restaurant’s Food Costs
With Sightline OS, a clear picture of your restaurant supply chain data is in your hands, allowing you to make better business decisions.
You’re in control of your restaurant’s COGS:

01
Identify cost savings opportunities and strategically improve your margin
02
Automatically flag strategic opportunities to make commodity purchases and negotiate contracts with real-time market data

03
Catch invoice errors, price overcharges, and contract non-compliance automatically
“ If you’re looking for a reliable partner that delivers exactly what they promise without the constant back and forth, I highly recommend Sightline. ”
— Buna Mam, Supply Chain Manager, Bonchon Korean Fried Chicken
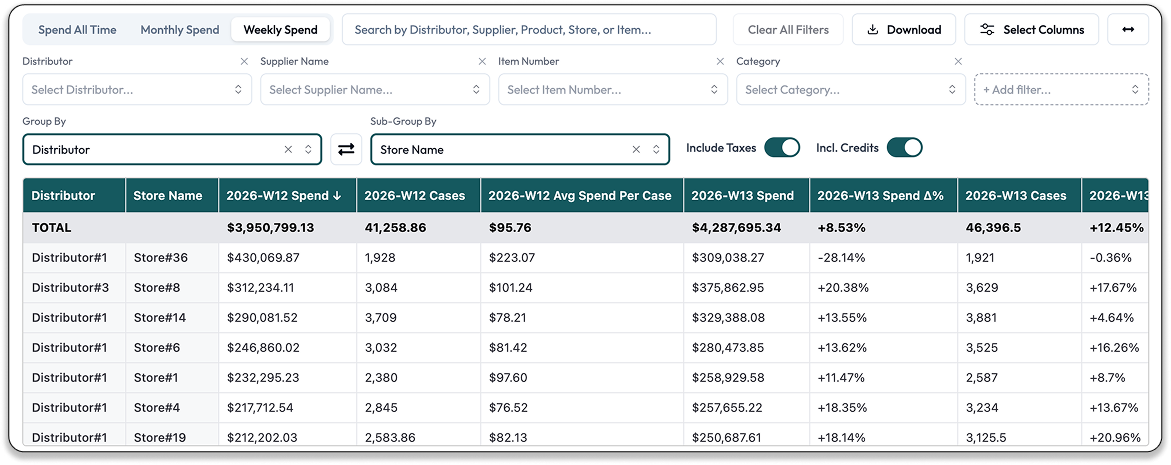
Real-time spend reporting puts data at your fingertips and flags weekly and monthly variances
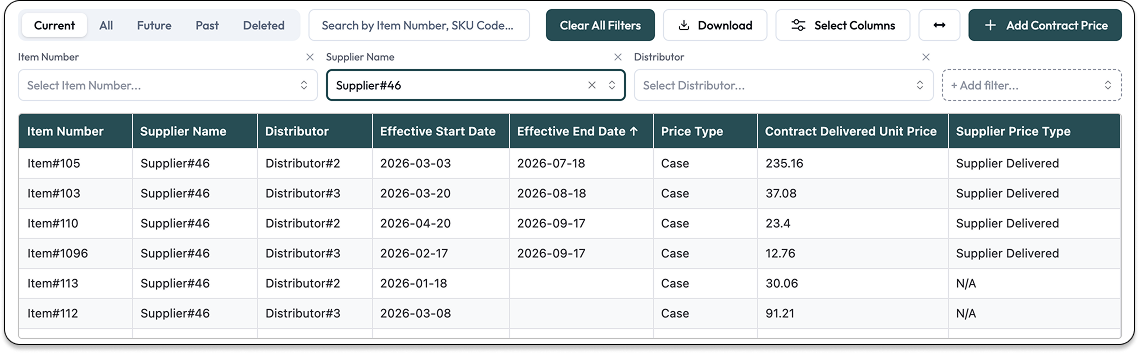
Manage contract pricing and contract expiration with our master contract pricing repository and automatically identify overspend with invoice reconciliation
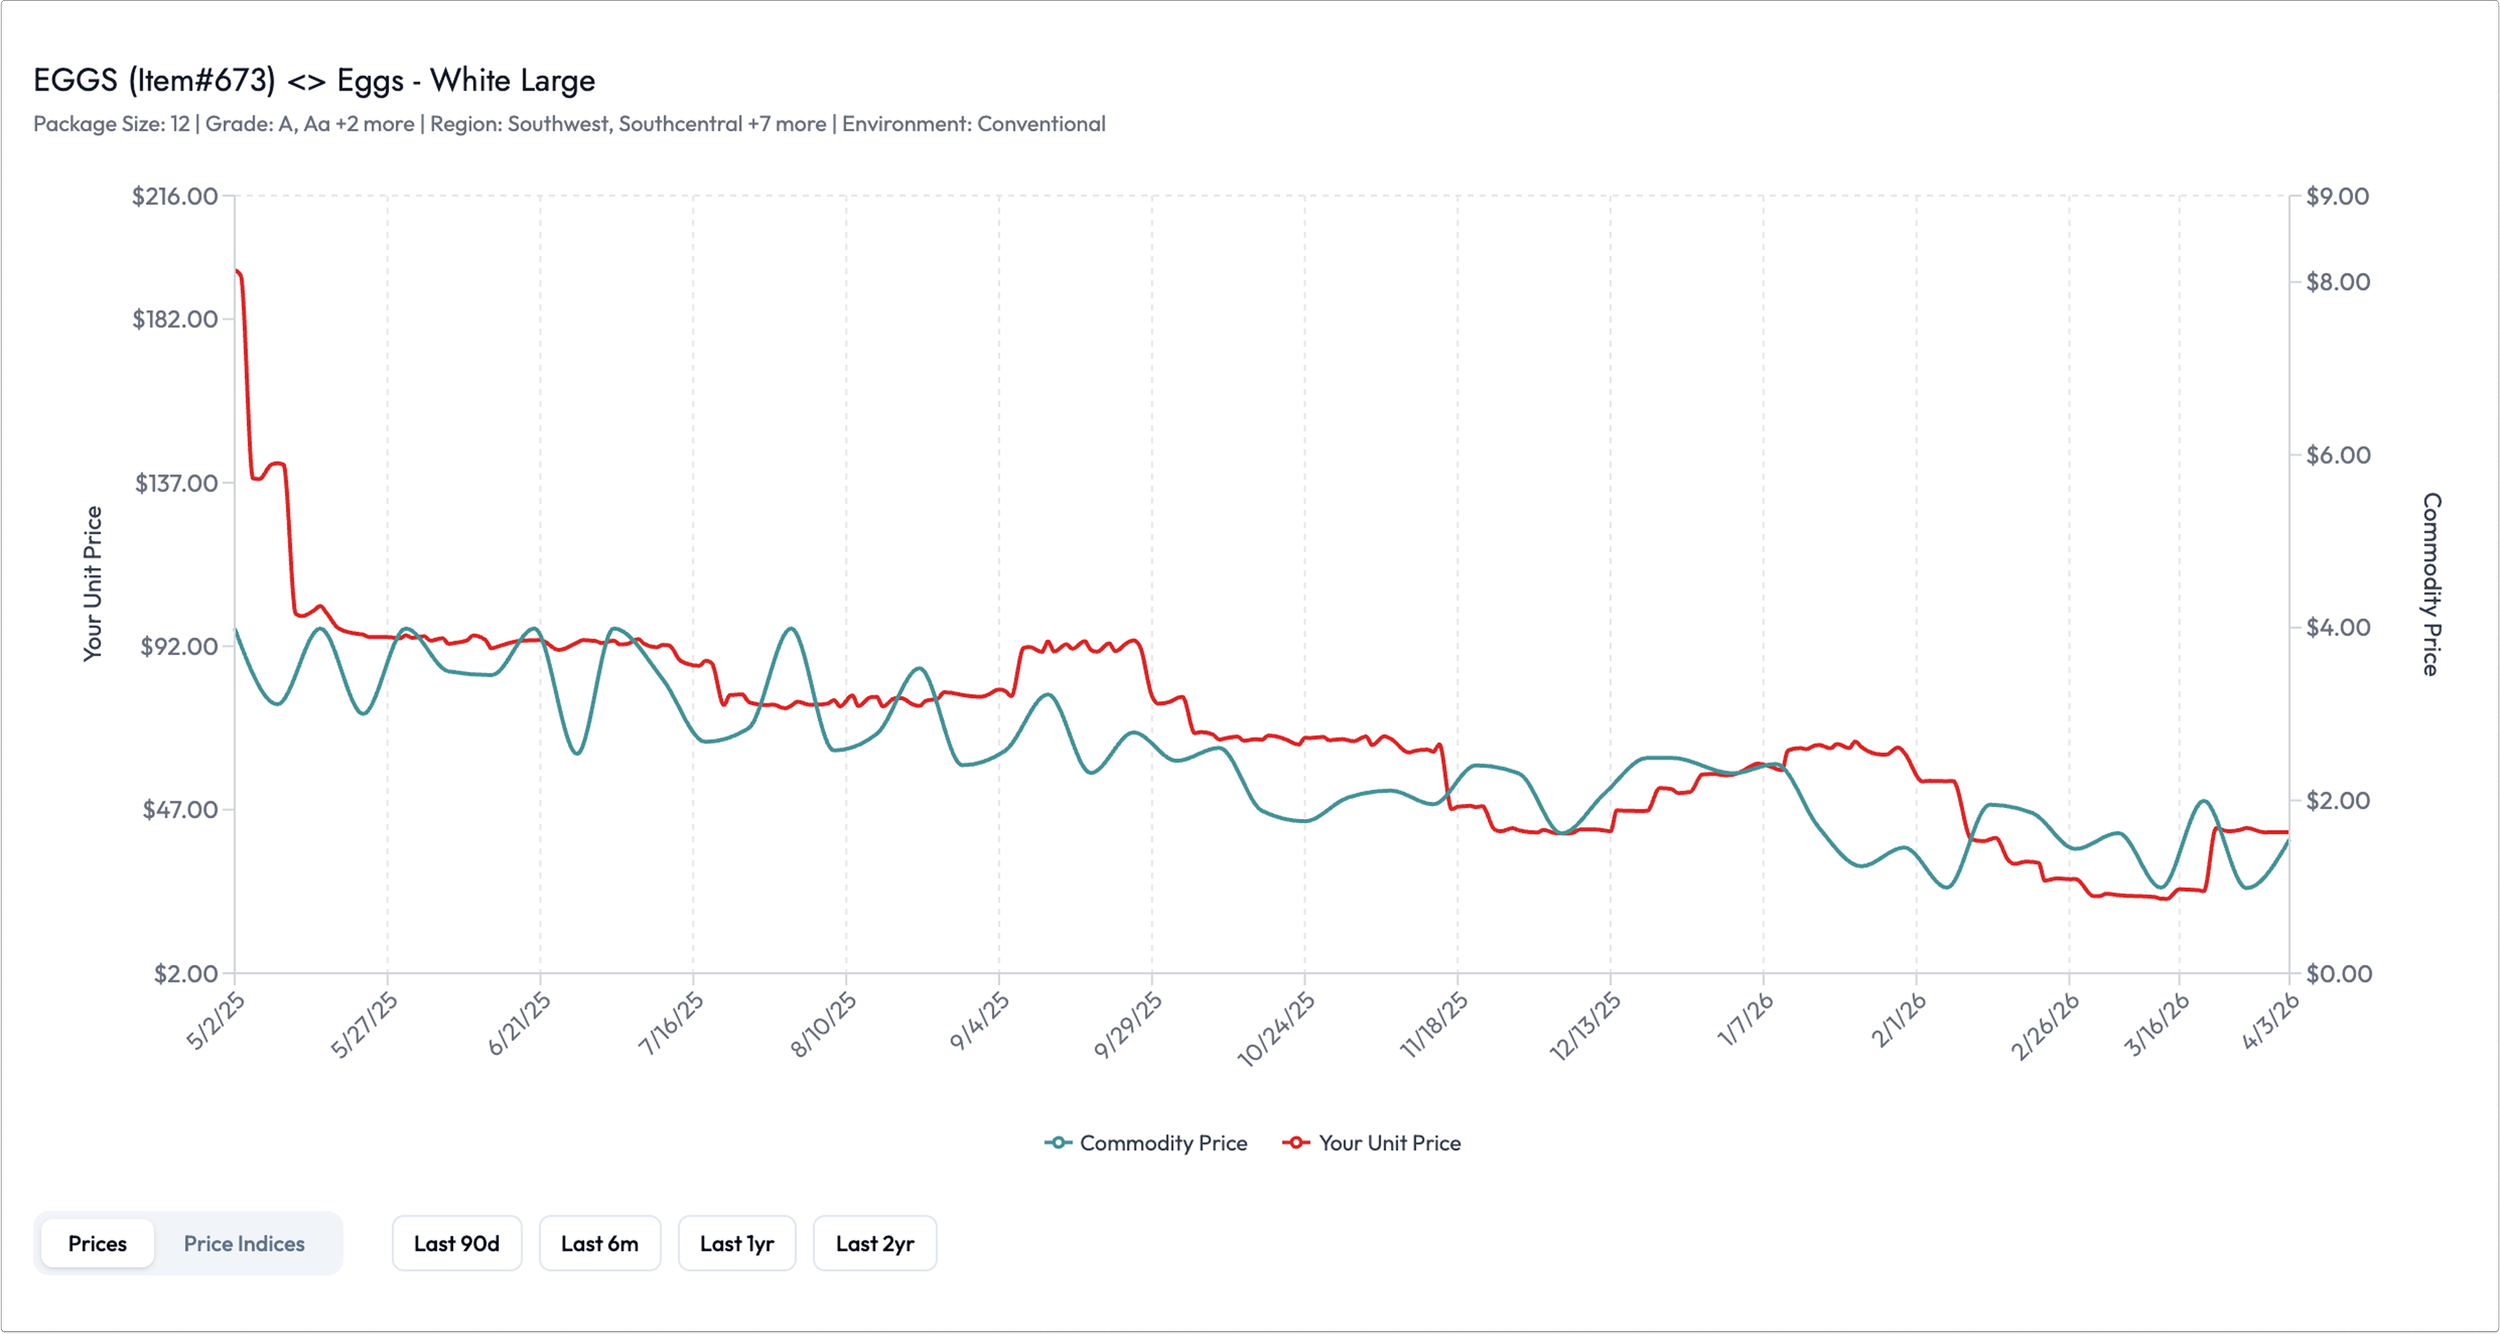
Use Sightline OS’ real-time commodity tracker to track invoice vs. 700+ market commodities. Use this data to drive contract negotiation, identify purchasing opportunities, and monitor key input prices like corn and soy

Manage your contracts, price audits, and more in one platform designed for restaurant supply chain teams.
Your Questions, Answered
-
For restaurant teams, managing COGS isn't the hard part — understanding why it's moving is. Variance reports tell you what happened. They rarely tell you where the leak started, whether it's a pricing issue, a forecasting miss, or a supplier problem that's been compounding for weeks. Sightline OS connects your spend data directly to your inventory and forecasting — so when COGS drifts, your team knows exactly what's driving it and can act before it becomes a board-level conversation.
-
Yes — though purpose-built options designed specifically for the restaurant and foodservice industry are rare. Most forecasting tools are either generic supply chain platforms that require heavy customization, or legacy restaurant systems that use basic formula-based models rather than true machine learning. Sightline OS was built specifically for this gap — delivering ML-powered demand forecasting that continuously learns from your owned historical data, adapts to seasonality and trends, and produces stable, high-accuracy forecasts without constant manual input. For restaurant and foodservice teams, that means smarter ordering decisions, fewer stockouts, and less excess inventory — all driven by models that get more accurate over time.
-
Sightline OS gives restaurant supply chain teams a smarter, more proactive way to manage inventory and demand. At the core is machine learning-powered forecasting that continuously learns from your data — adapting to seasonality, sales trends, and demand shifts automatically, without manual rule-setting or constant maintenance. That forecasting feeds directly into inventory optimization, so your team always knows what to order, when to order it, and where risks are building — up to 12 weeks in advance. The result is fewer stockouts, less waste, tighter COGS control, and a team that spends less time reacting and more time on strategic work that actually moves the business forward.
-
The best AI-driven supply chain tools for restaurants and foodservice businesses are purpose-built for the unique demands of the industry — handling high SKU counts, perishable inventory, fluctuating demand, and complex supplier networks. Sightline OS is purpose-built for exactly this, using machine learning to deliver demand forecasting, inventory optimization, and COGS management that's accurate, stable, and built for the pace of foodservice operations. Unlike generic supply chain platforms or legacy restaurant tools that bolt on AI as an afterthought, Sightline is AI-native from the ground up, giving supply chain teams the predictive intelligence they need to stop firefighting and start making proactive, strategic decisions.
-
The best way to see Sightline OS in action is to request a demo directly HERE. During the demo, our team will walk you through how Sightline's forecasting, inventory optimization, and COGS management works for your specific supply chain needs — and walk you through pricing based on your business size and requirements.