

Every Report Your Supply Chain Team Actually Needs — In One Place
Sightline OS delivers real-time visibility across spend, inventory, supplier performance, forecasting, and commodity markets. No spreadsheet heroics. No waiting for the weekly report.
Most restaurant supply chain teams don't have a data problem. They have an access problem. The information needed to make better purchasing decisions, catch invoice errors, flag supplier issues, and plan for the next twelve weeks already exists — it's just scattered across distributor portals, ERP exports, and shared drives that nobody fully trusts.
Sightline OS connects that data into a single reporting and insights layer, updated in real time, built specifically for the way restaurant supply chain teams actually work.
Executive Dashboard
The supply chain view your leadership team has been asking for
The Executive Dashboard gives VPs, Directors, and supply chain leaders a single, always-current summary of the metrics that matter most — without waiting for someone to pull a report.
What's included:
Service level monitoring of distributors and suppliers
Spend monitoring to identify pricing trends and flag upcoming contract expirations
Customizable filters for DC-and supplier level drill-down and custom date ranges — built for QBR use
COGS & Spend Reporting
Know exactly where your food costs are going — and where they're leaking
Spend reporting in Sightline goes beyond the weekly summary. Every report is interactive, exportable, and connected to the invoice and contract data that explains what you're seeing.
What's included:
Interactive spend breakdown by store and item — drill from chain-wide to individual location in seconds
Invoice reconciliation against contract pricing — automatically surfaces recoverable spend your team would otherwise miss
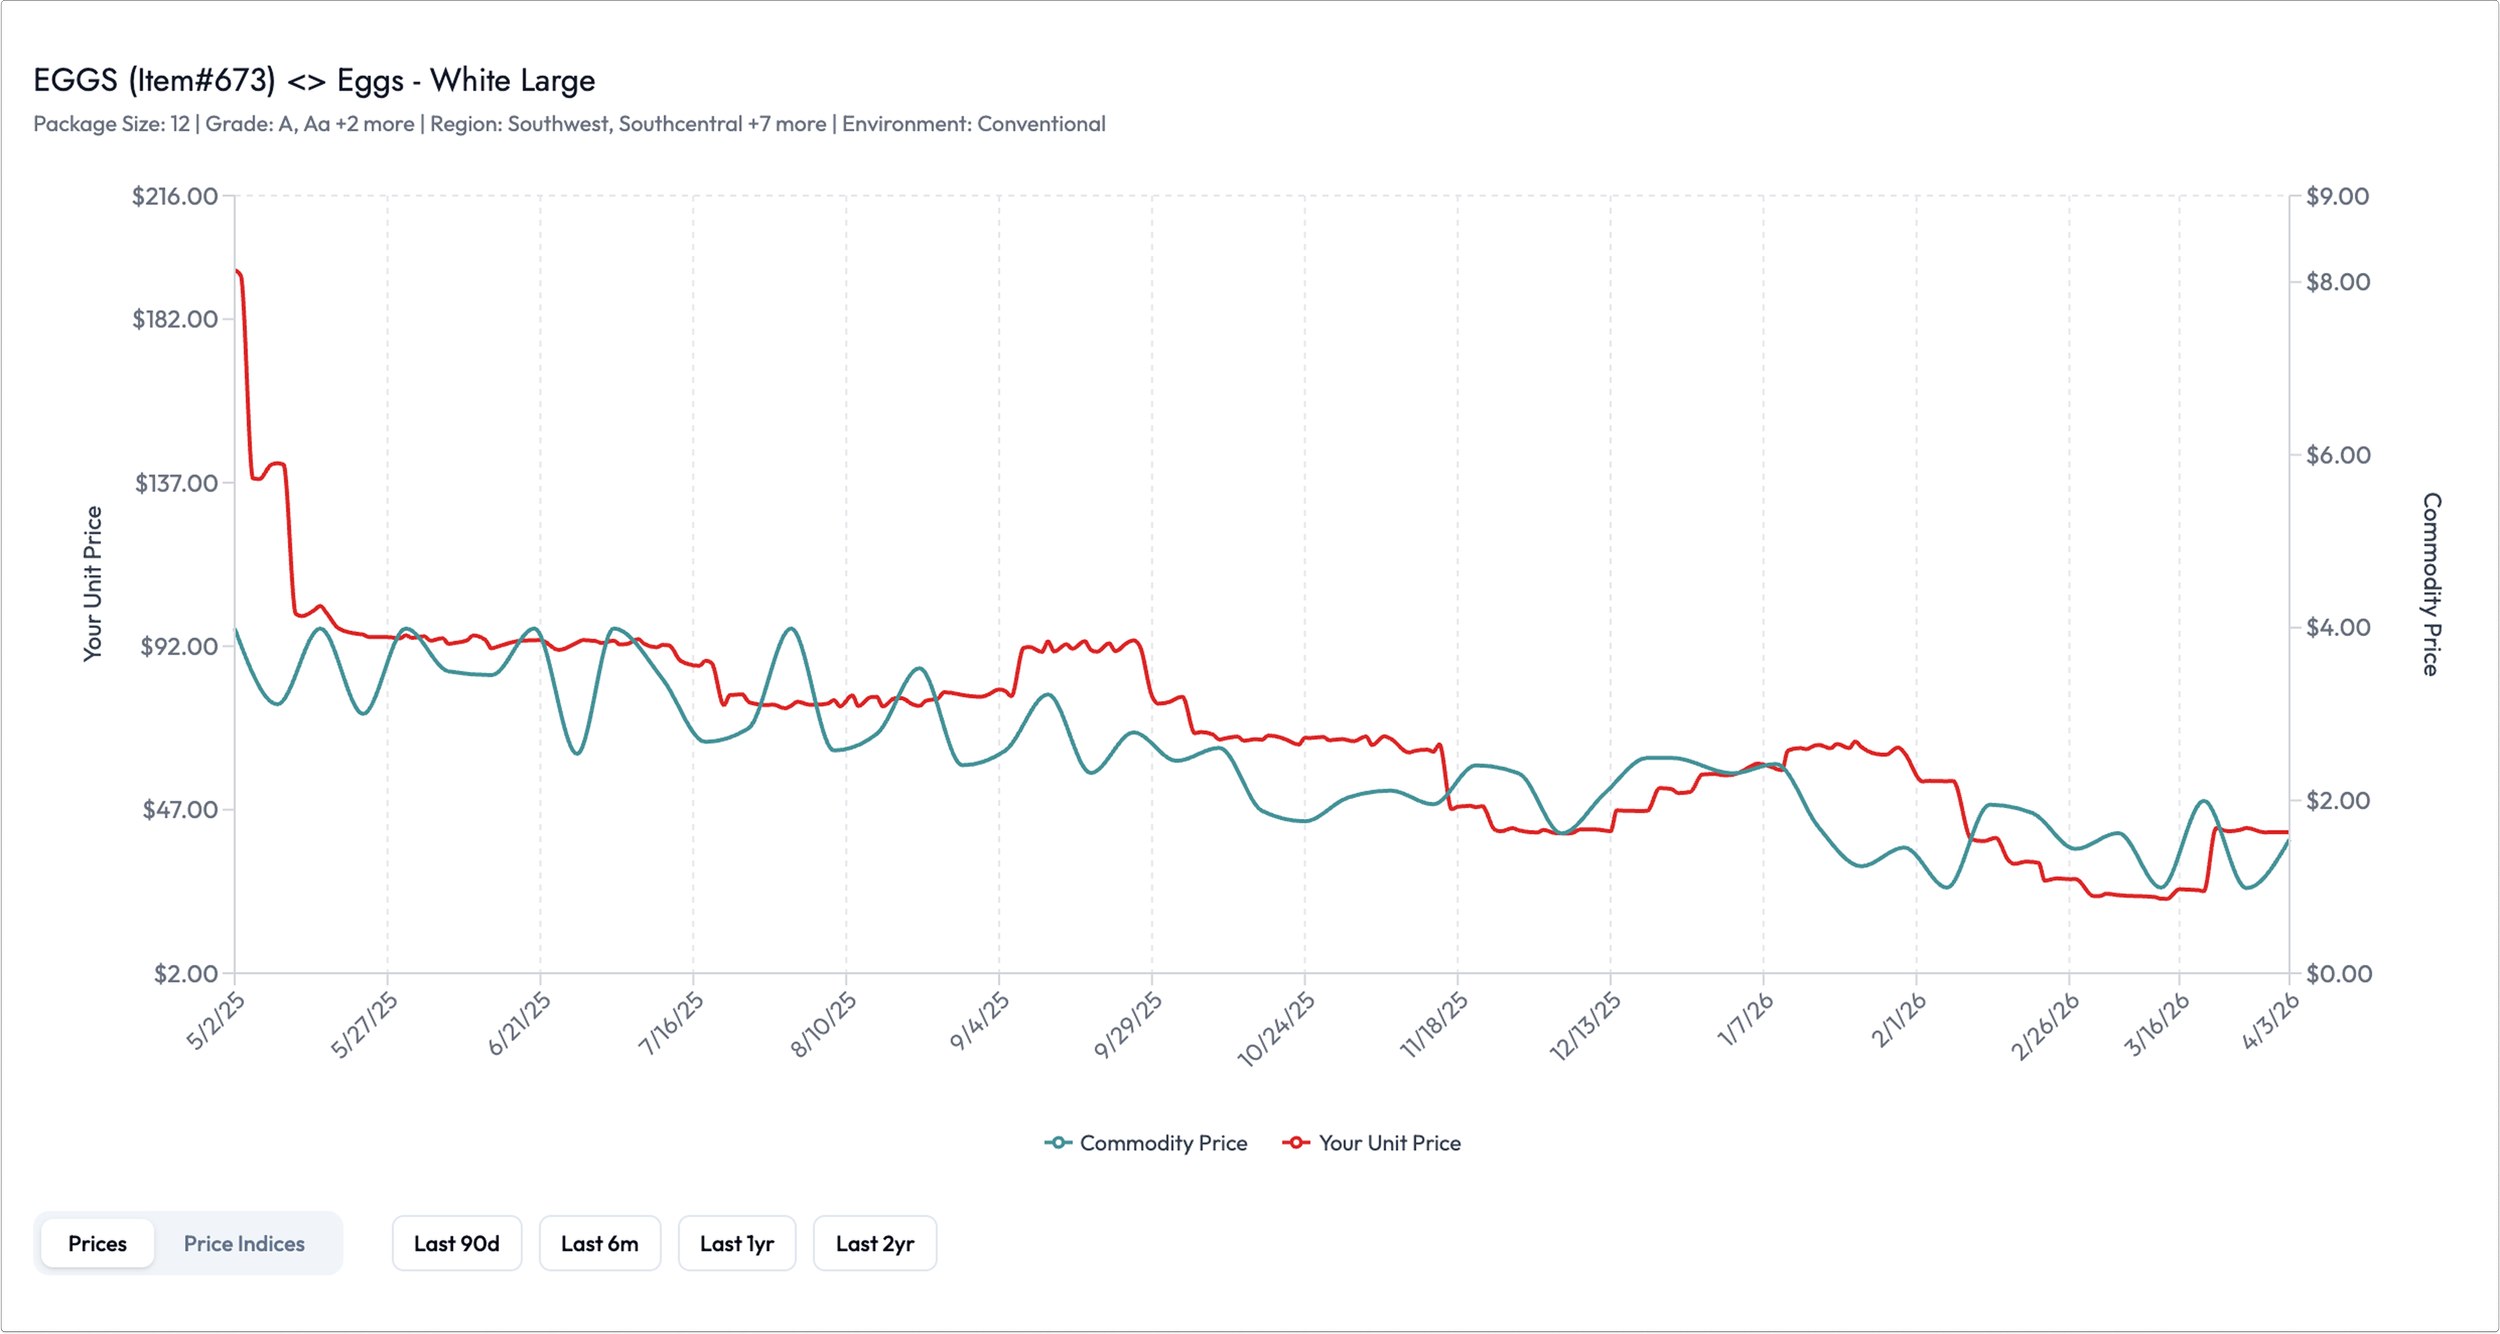
Price trend analysis benchmarked against commodity indices
Price variance auditing
Credit memo and recoverable spend tracking with fiscal period flagging — no more chasing credits across periods
All reports exportable to Excel
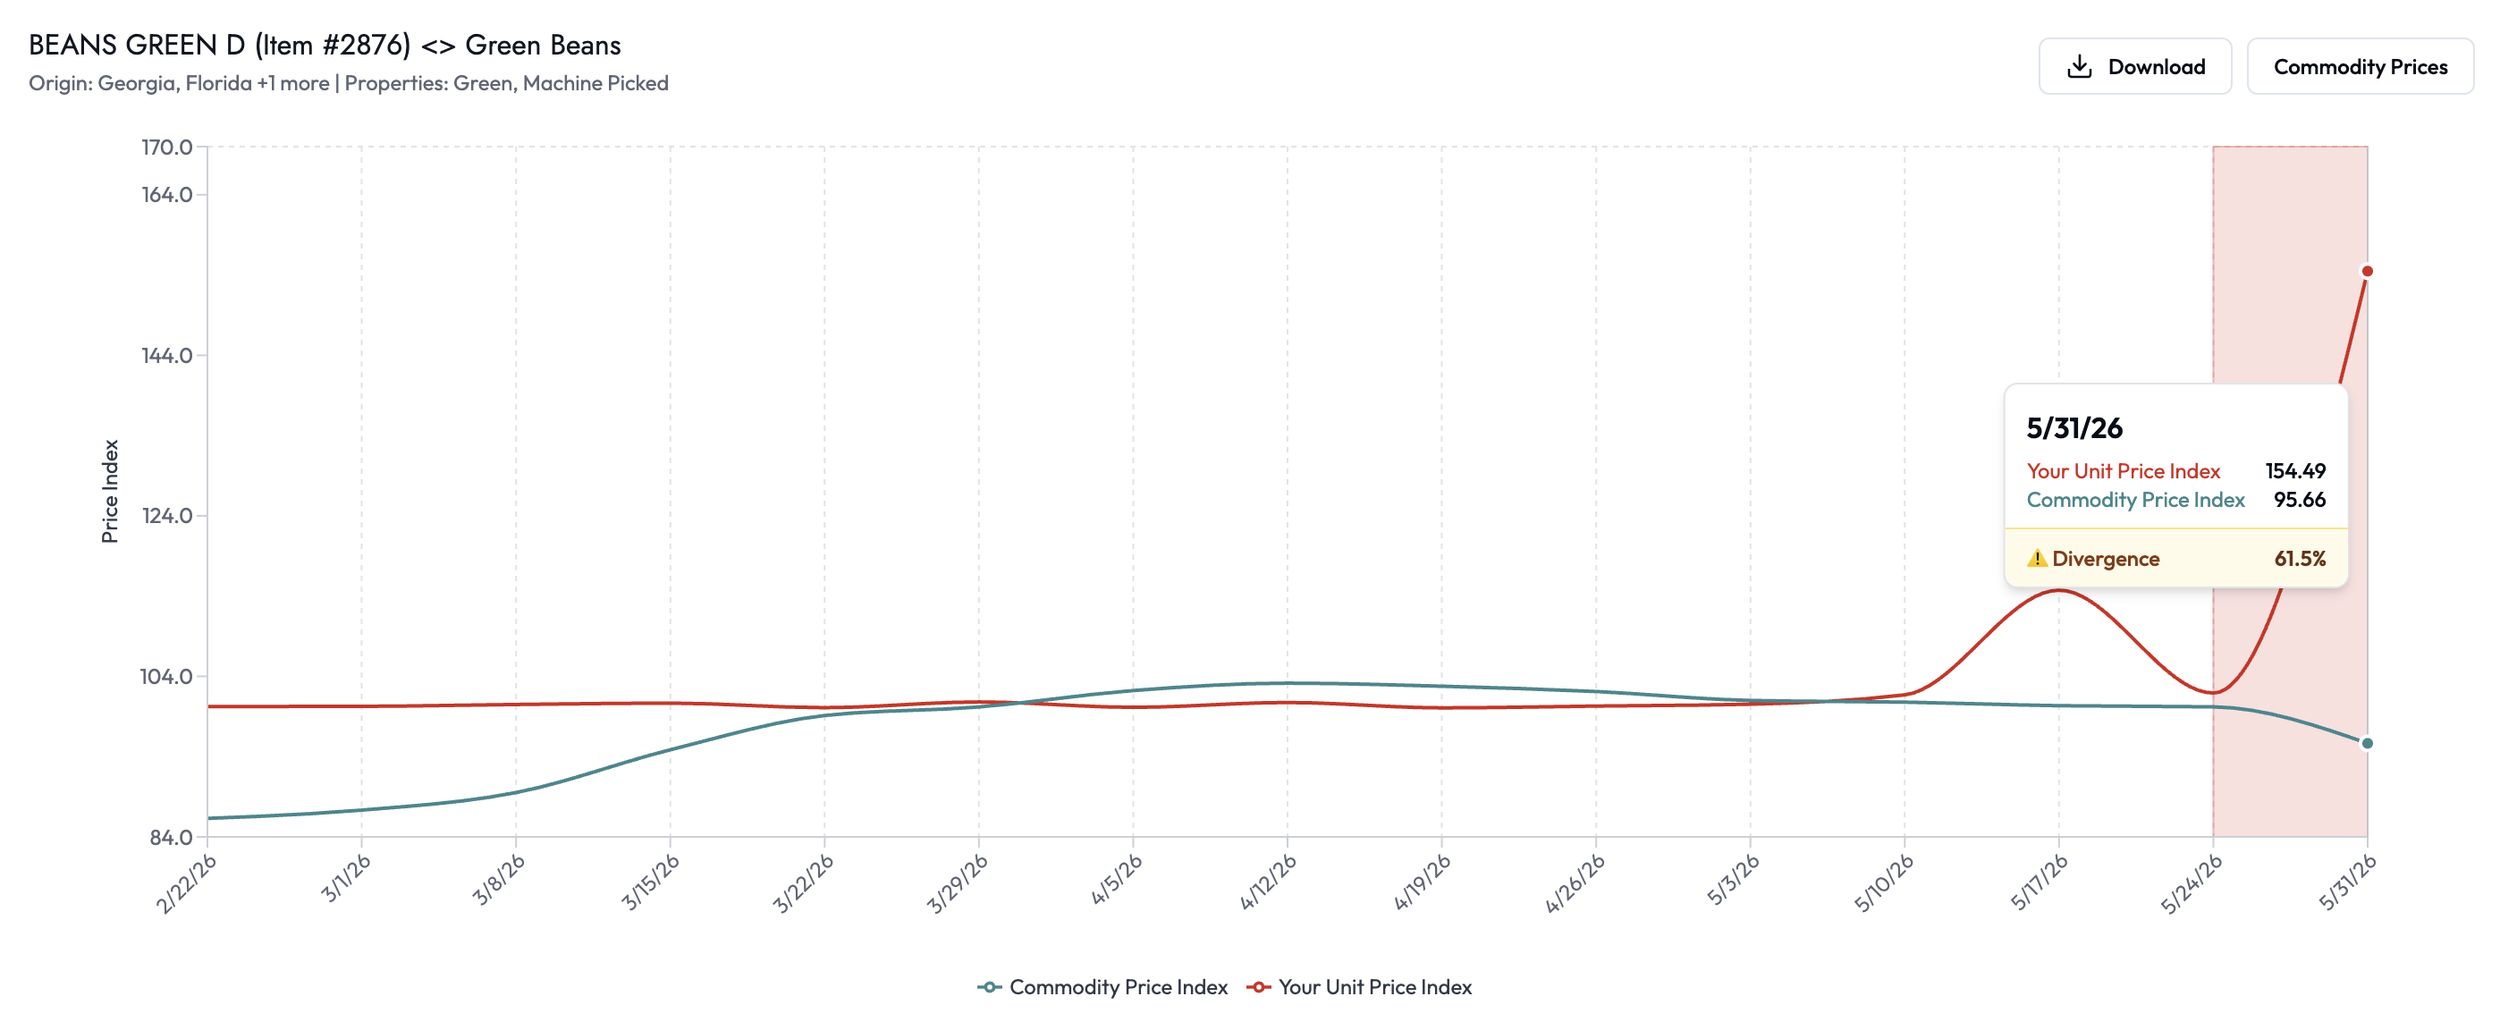
Commodity Price Tracking
Know when the market is working for you — and when it's not
vSightline's Market Commander tracks 700+ USDA commodity price indices in real time and benchmarks them directly against your invoice data — so your team knows the optimal moment to lock contracts, and gets alerted immediately when pricing moves out of alignment.
What's included:
700+ commodities tracked with automatic data feeds
Price correlation analysis vs. your actual invoice data — not just market data in isolation
Optimal lock timing recommendations — act on data, not gut instinct
Customizable alert thresholds (default 20% variance) — set by category, supplier, or item
Visual dashboards showing favorable and unfavorable market positions at a glance
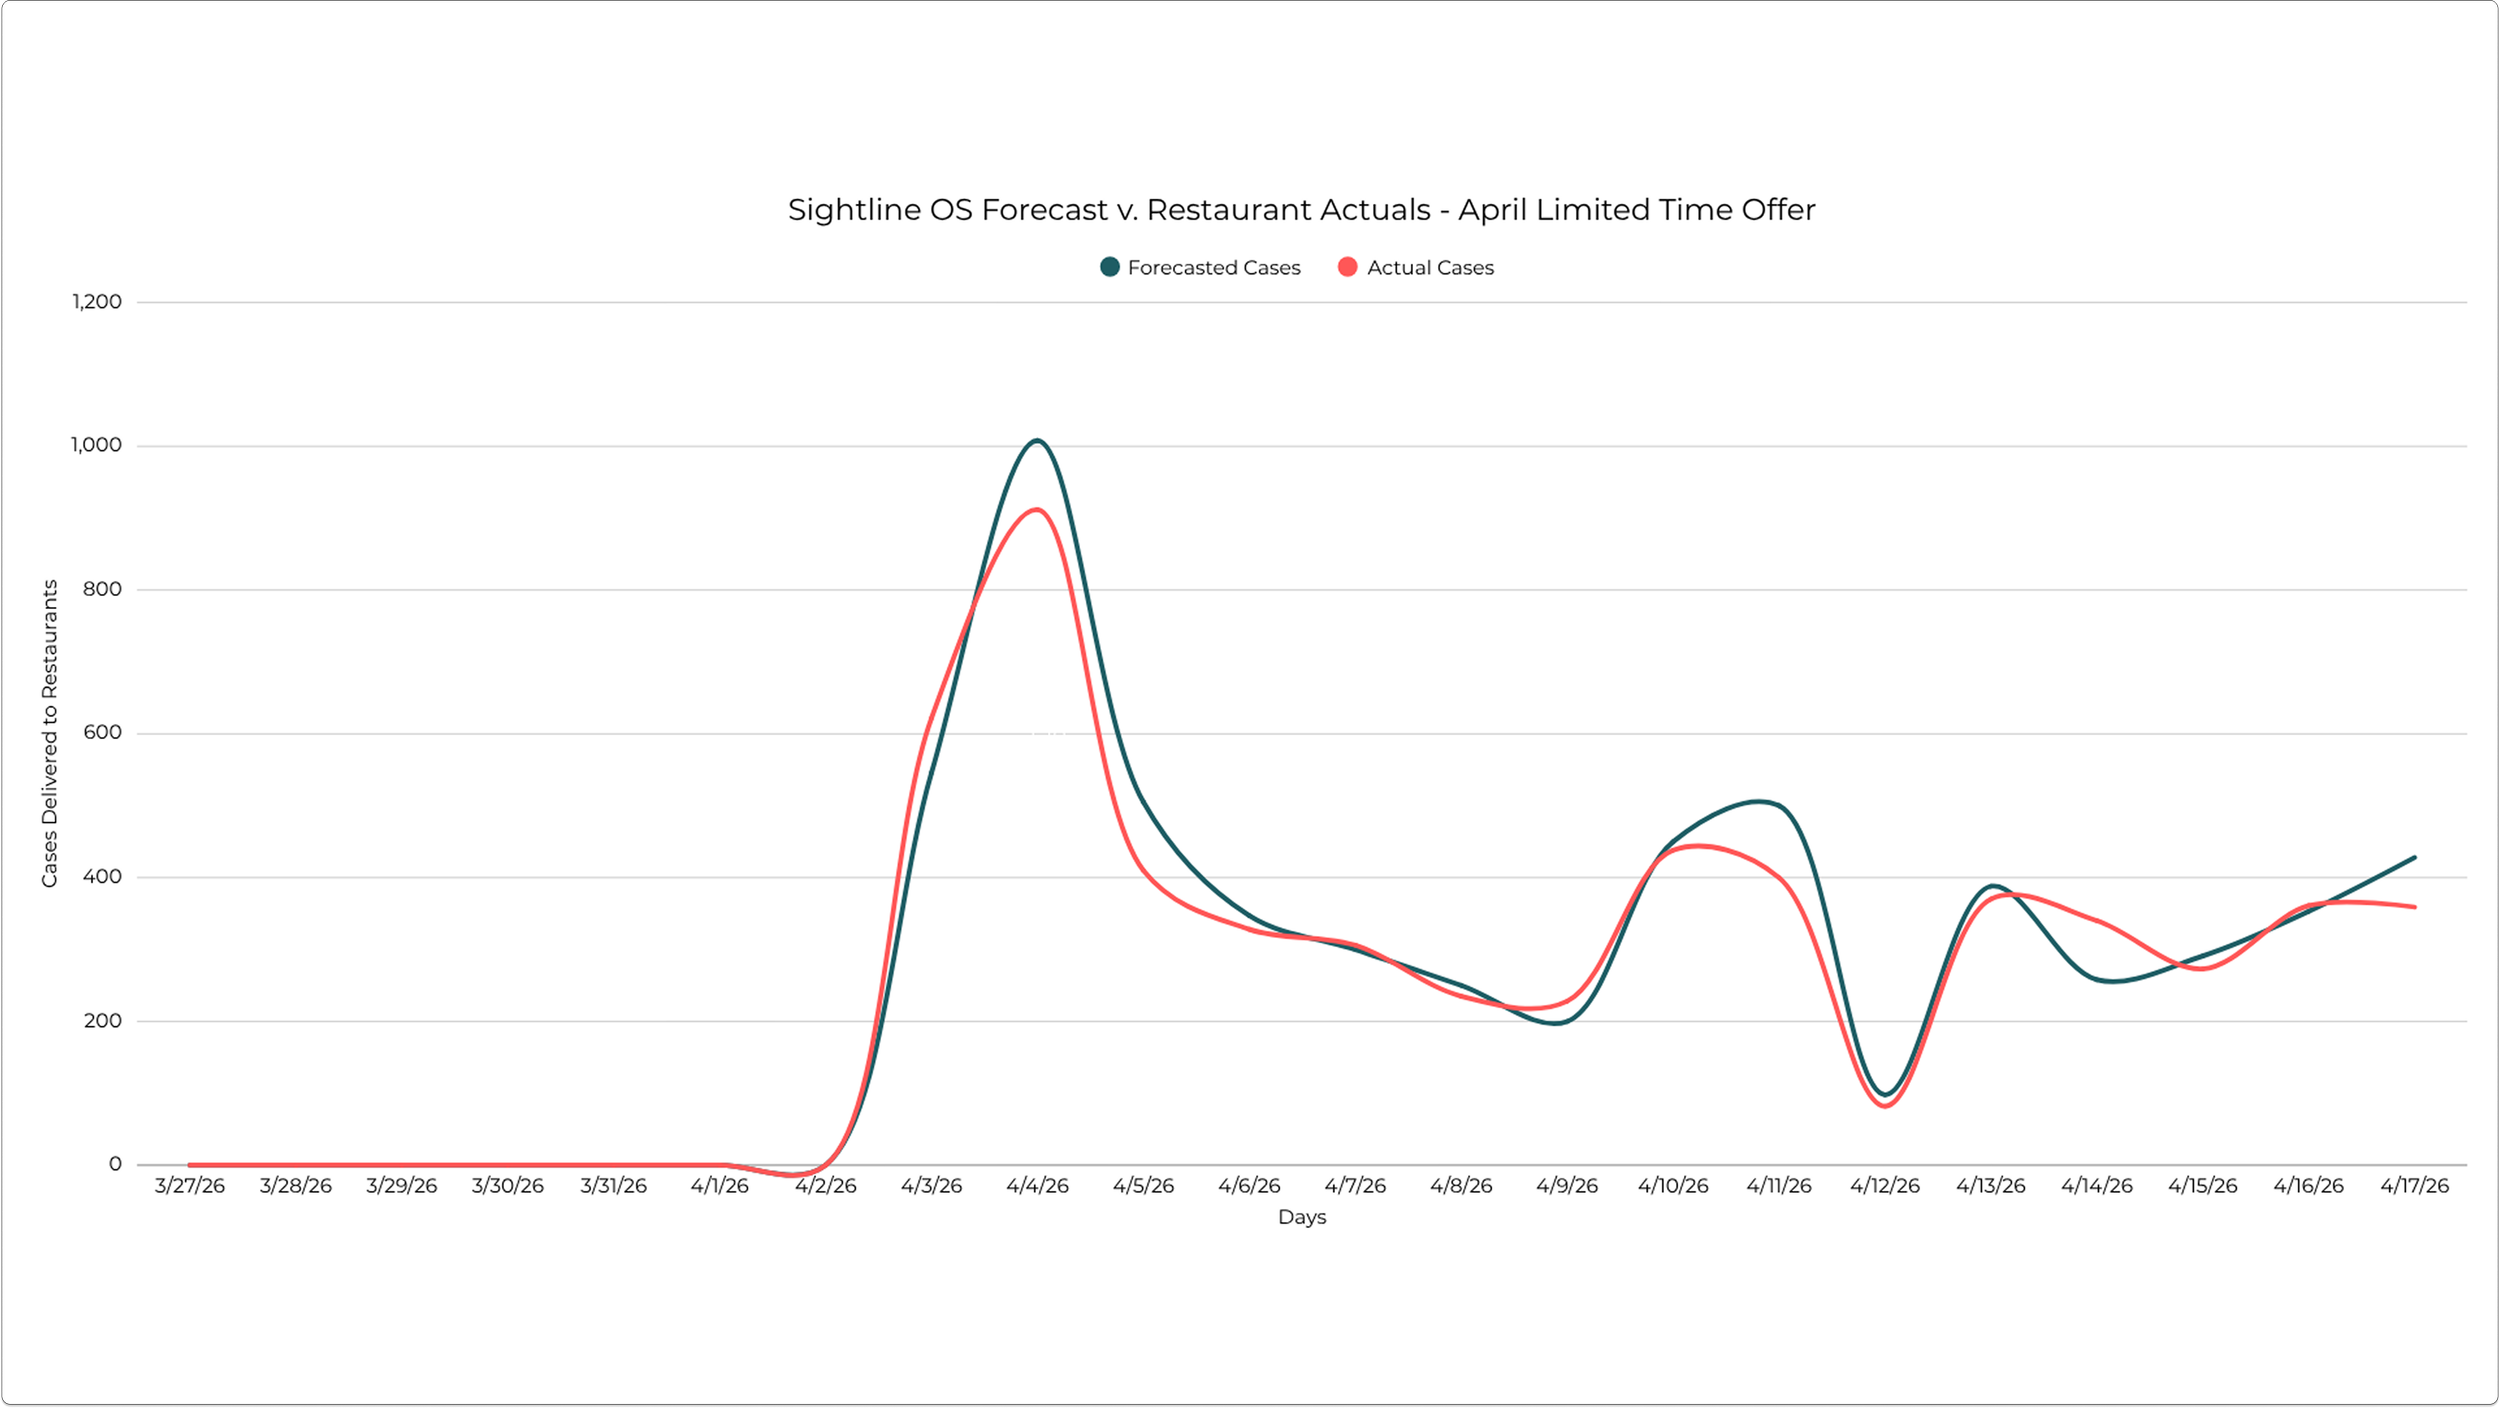
Forecasting Reports
A 12-week forward look —
updated daily
Sightline's machine learning-based forecasting reports give your team the forward visibility to make purchasing decisions with confidence, weeks before demand signals are fully visible.
What's included:
Machine learning-based demand forecasting that targets to reach 95% system-wide accuracy
12-week forward look updated daily — not weekly, not monthly
Incorporates seasonality, holidays, NRO and LTO calendars, and marketing campaigns automatically
Day-by-day actual vs. forecast tracking so your team can see exactly how the model is performing
Cannibalization modeling for menu changes — understand how new items affect existing SKU demand before launch
Inventory & Supplier Performance Reporting
Real time daily updates — because supply chain doesn't wait for the weekly report
Most supply chain reporting runs on a daily or weekly cadence built for a world that moves slower. Sightline updates inventory and supplier data to immediately reflect their WMS or ERP — so your team is always working from current information, not last week's snapshot.
What's included:
Real time data updates — flags late deliveries, short deliveries, out-of-stock items, and below-safety-stock positions as they happen
Supplier scorecarding and fill rate tracking across your full distributor network
Aging and obsolete inventory flagging with min/max days on hand — catch waste before it compounds
Root cause analysis with supplier performance tracking — when something goes wrong, know exactly where it started
Cost Calculator
Model supplier changes before you make them
The Cost Calculator gives your procurement and supply chain teams a way to stress-test supplier decisions before they're made — modeling the full cost impact of allocation changes, new supplier additions, and price-per-case scenarios against your actual historical spend.
What's included:
Models the impact of supplier allocation changes on total spend and budget across your network
Allocation percentages, and price-per-case scenario modeling in one tool
Supports new supplier addition scenarios — see what the numbers look like before you sign anything
One platform. Every report your supply chain team needs.
Sightline OS was built for the restaurant supply chain teams that can't afford to be reactive — the ones managing hundreds of locations, dozens of supplier relationships, and a P&L that moves every time a commodity market shifts.
Frequently Asked Questions
-
Inventory and supplier performance data updates four times per day. Forecasting reports update daily. Commodity data is tracked in real time. Spend and invoice data updates as new distributor data flows in — typically daily for most distributor integrations.
-
Yes — all COGS and spend reports are exportable to Excel. The platform is designed to fit into your existing workflows, not replace them.
-
Yes — Sightline supports automated alerting via Slack with configurable high and low priority channels. Threshold-based anomaly notifications can be customized by your team so the right people get alerted on the right issues without noise.
-
Yes — the Executive Dashboard includes customizable date range filters for monthly and quarterly views, designed specifically for QBR use. DC-level filtering lets you drill into specific markets or distribution relationships for leadership conversations.
-
Sightline's ML-based forecasting achieves 95% system-wide accuracy and 77% accuracy at the item-DC level. The model incorporates seasonality, holidays, NRO and LTO calendars, and marketing campaigns — and updates daily so it's always learning from the most recent demand signals.